DATA
Data analysis and visualisation
Data analysis and visualisation turns raw data into charts and dashboards you can read at a glance, and labels data so it can be used.
Analytics · visualisation · dashboards · labelling
What is data analysis and visualisation?
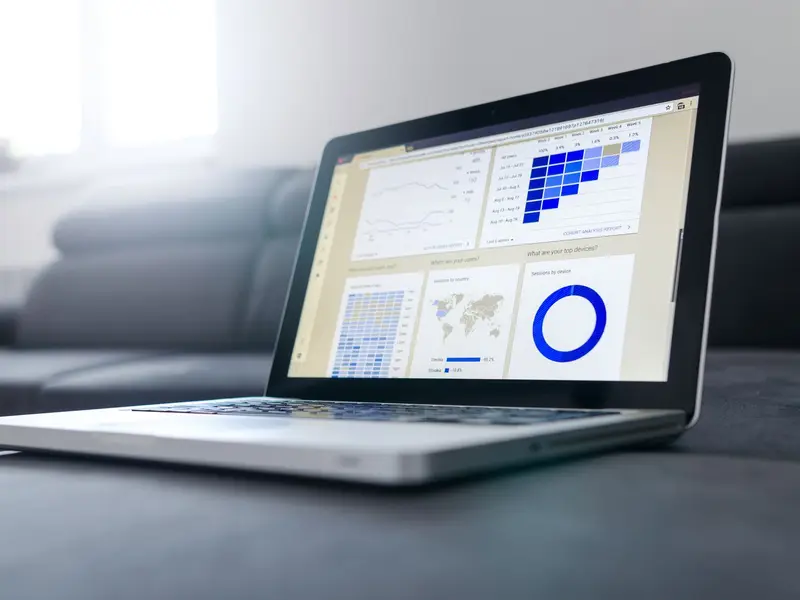
Analysis works out what the numbers say; visualisation shows it; a dashboard keeps it on one screen, up to date.
What’s included?
- Data Analytics
- Working out what the numbers say.
- Data Visualization
- Turning numbers into charts people can read.
- Data Tagging & Annotation
- Labelling data so a machine learning model can learn from it.
- Dashboards
- One screen showing the numbers that matter.
Who owns the result?
Dashboards read from your own accounts through read-only connections you can revoke in one click. What you own.
How does it fit my business?
One number that tells you whether it's working is worth more than twenty charts.
The price depends on scope, and the free audit is how that scope is worked out. You see it before you pay, and the contact page is where a plan starts.
How is this different from business intelligence?
Business intelligence aims the data at business decisions; this page is the analysis, dashboards and labelling themselves. Business intelligence.
Questions people ask
- Is my data moved anywhere?
- No. Connections are authorised from your own login and are read-only unless you say otherwise; nothing is moved, copied out or re-created elsewhere.
- Can I disconnect it myself?
- Yes. Every connection can be revoked in one click, from your account or ours, at any time, without asking anybody.
Start with what you already have.
The free audit reads your live site and tells you what’s slow, what a searcher can’t see, and who’s getting the calls instead of you.
Rather talk it through first? Message on WhatsApp, or send a message and it reaches the person who would do the work.